
A Hands-On Guide to Serverless ETL with AWS
- Infrastructure & Architecture


Fábio Colombo Fábio Colombo
February 1, 2023 • 14 min read
A serverless architecture allows you to configure your system once and avoid most of the maintenance and operational work. Serverless architectures will generally scale well and without any operator interaction. Most serverless architectures are based on cloud services priced based on how much you use the service. AWS Lambda, API Gateway, CloudFront, and S3 are examples of this. AWS Lambda pricing is a product of the run time of your function, i.e. how long it takes to load and run and the amount of memory and disk used by the function. API Gateway and CloudFront pricing are both the sum of requests handled and data transferred. S3 pricing depends on the amount of data stored (as well as how this data is stored) and the amount of data transferred.
This pricing model is great for projects just starting out since they provide a robust infrastructure that requires little setup and maintenance while likely costing less than running a traditional infrastructure based on your own VMs or on-premise. Although serverless architectures require less setup and maintenance, it is still important to check if your costs are scaling well with increasing traffic. In this blog post, we will look at a cost reduction analysis for one of our projects and how you can apply this to your own projects.
Cost analysis always starts with the bill. AWS, GCP, Azure, and other cloud providers have services specifically for cost analysis. AWS provides the Cost Explorer dashboard, which allows you to filter your costs by service, such as Lambda, API Gateway, S3, etc., and can also project month-end costs based on your previous usage. Google Cloud has a similar feature in Cloud Billing, as does Azure and many other cloud service providers. Learning to use the features available for your provider is an important step to understanding and optimizing your cloud infrastructure costs.
Another important aspect of cost analysis is how you plan to distribute costs among your projects. By using a different AWS Account (or GCP project) for each project, you can have a clearer picture of costs per project. AWS allows you to have linked sub-accounts so that billing is centralized in a single account, but resources can be split up among different accounts. This is great for cost analysis as well as for security, as credentials can be managed with greater ease in each sub-account. You can give a team greater control over their specific account or project without having to worry about them accidentally messing up infrastructure managed by a different team.
If creating new accounts or projects is not an option, you still have options for splitting up costs. AWS allows you to use special tags for cost allocation. GCP allows you to add labels to cloud resources so that you can later filter costs using these labels. Depending on your cloud infrastructure, you may need to modify your code to use logs or register metrics to allocate costs.The AWS, Azure, and GCP cost management features also allow you to create budgets and automated alerts to inform you beforehand that you are spending more than you expected, giving you time to take action to reduce your costs.
Although learning about the newest technologies may seem more exciting than learning how to navigate and query cost data, this is an essential skill if you want to optimize your infrastructure. Knowing how each cloud service is priced will help you better plan the correct infrastructure for each use case. Knowing how to analyze costs will allow you to focus your optimization efforts on the services that make up the largest percentages of cloud costs. Like in software optimization, the final savings will be a product of the percentage saved by the service and the percentage of the cost made up by that service.
Savings = Service cost percentage * Service cost savings
This blog post will center on our analysis of Pourwall. Pourwall is a simple and free digital menu system for bars and breweries. It comprises a landing page to inform users about what Pourwall does, a web app to configure menu items and how they are displayed, and an app that runs on TVs to display the menus to customers.
Pourwall runs on cloud infrastructure hosted on AWS. We use S3 to host the website content, such as HTML, CSS, and Javascript files and images. CloudFront is used to distribute this content, RDS to host our database for storing user data, Lambda functions for our backend API, and Cloudwatch for logging. RDS has a fixed monthly cost based on the instance size. Everything else is charged by usage. The more requests we receive, the more we have to pay. Pourwall costs were above expected for the number of visitors and devices we had connected. We used Cost Explorer to analyze our AWS service usage and costs and determine which AWS services we should focus our efforts on to obtain a cost reduction.
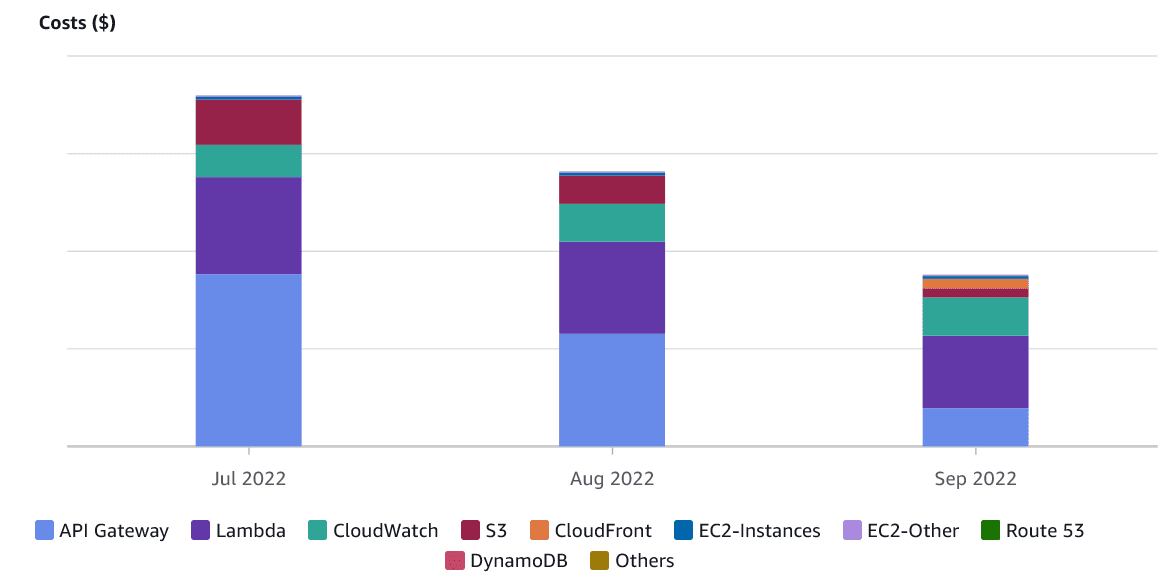
This is easy in Cost Explorer, as it can group our costs by service. The graph below shows how much we spent per day during the previous month on the various AWS services we use.

Analyzing this graph, we can easily see that the API Gateway service should be a priority. If we were to save 50% on our API Gateway costs, which make up 49% of our monthly costs, we would lower our final bill by 24.5%. On the other hand, If we lower the Cloudwatch costs by 50%, our final bill would only be 4.5% smaller since Cloudwatch is only 10% of our final bill. This analysis should be redone as you make improvements, as some changes can impact more than one cloud service, making optimizations to other services more worthwhile.
Looking at our breakdown, we see that most of our cost is due to the large number of API requests we handle, as the second most significant cost is AWS Lambda, where we run our API. Next up comes S3, which is also unexpected. While our site is hosted on S3, we also use a CloudFront distribution for the content, so we generally expect CloudFront to cost more than S3. We’ll examine these three services in more detail below. Since the API Gateway service makes up most of our monthly cost, we’ll start there.
Pourwall uses a REST API Gateway to handle incoming requests to our Lambda function. AWS REST API Gateway has many useful features not available in the newer HTTP API Gateway, such as WAF integration and support for canary releases. It does, however, charge more per request. As of writing, REST API Gateways are billed at US$3.50 per million requests, while HTTP API Gateways are billed at US$1.00 per million requests. If you are not using the additional features, switching to an HTTP API Gateway will be cheaper.
If you use a custom domain name for your existing API, the switch to an HTTP API Gateway is done entirely inside of AWS-managed infrastructure. You won’t have to worry about DNS propagation issues or client-side code changes. Set up a new HTTP API Gateway to behave as your existing REST API Gateway, and then update the custom domain mapping in the console when you are ready to switch.
The graphs below illustrate the effect on our cost of switching from a REST to an HTTP gateway. The daily costs are now, on average, 24.8% of what they previously were. The data below covers an interval of 3 months and includes data before and after this change (and all other changes in this blog post).
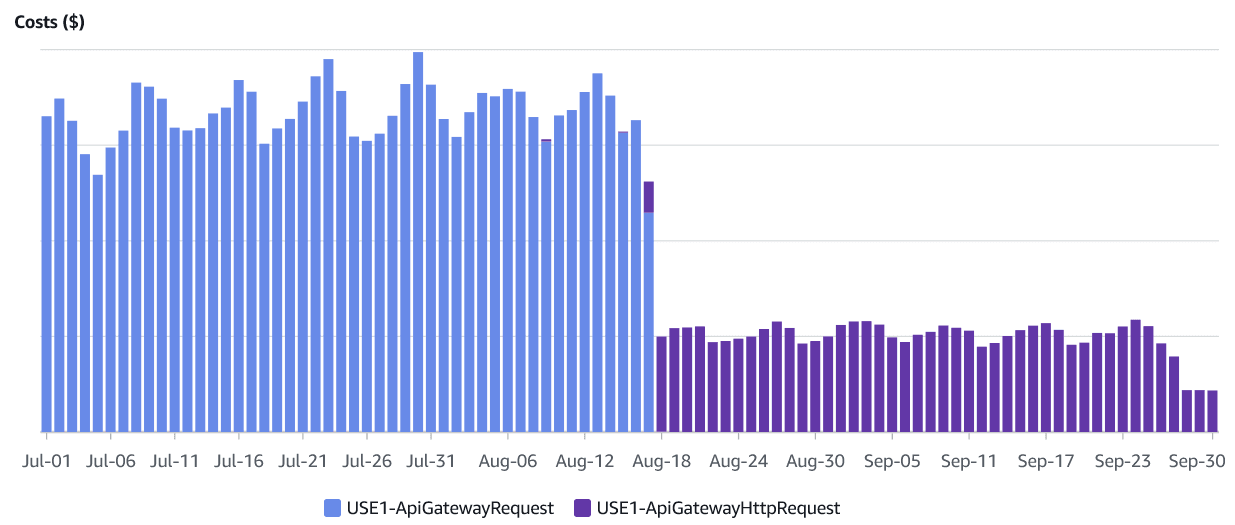
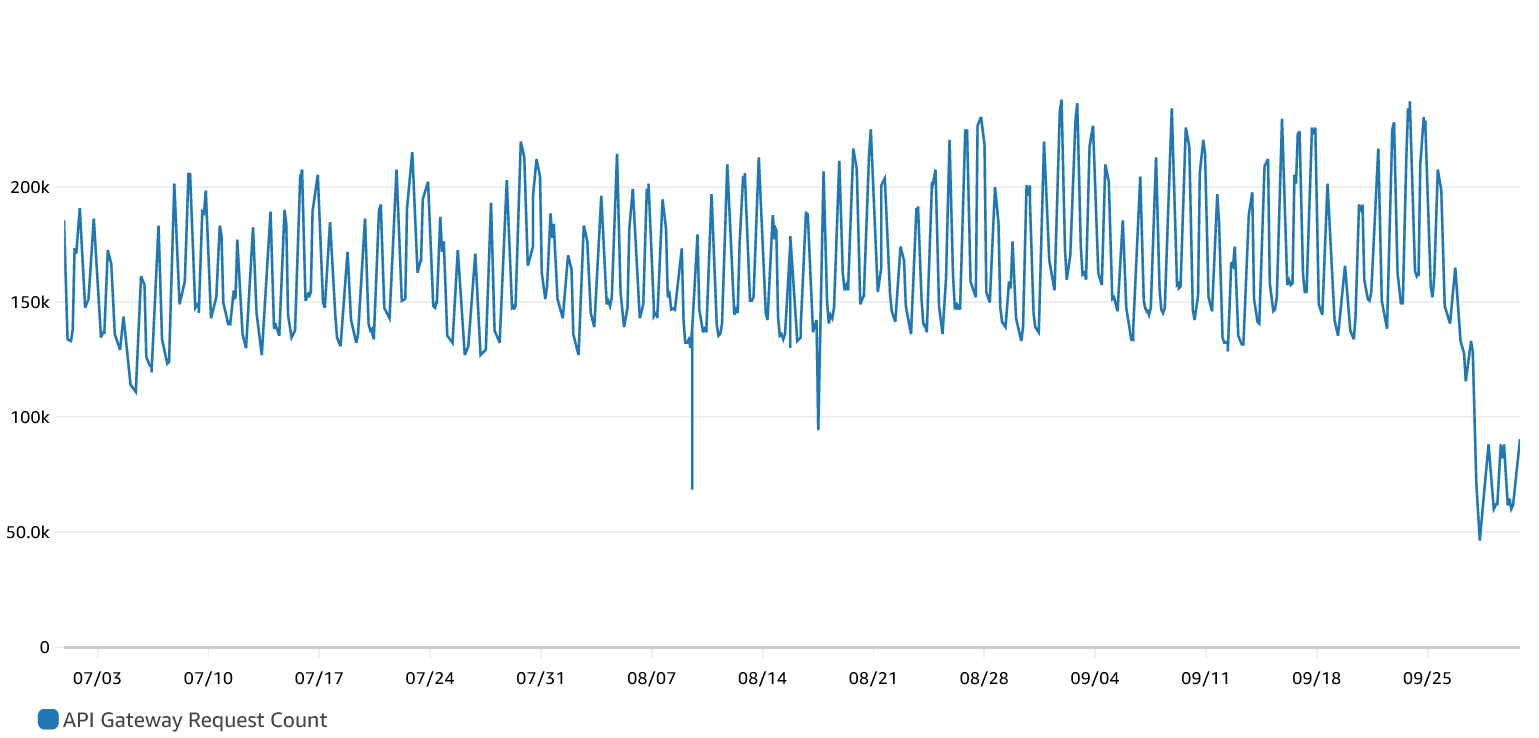
Below we can see the number of requests received by both API Gateways during the same period.
AWS Lambda charges are based on the time your function takes to run. There is also a charge for the number of Lambda invocations made. We will leave this out of our discussion as changes to that require changing client code. You are also charged for the amount of memory configured and ephemeral storage, using the formula below:
*Lambda Cost =Function Run Time *(Ephemeral Storage Cost + Memory Cost) *
At a first look, lowering your costs when working with Lambda functions can be done by either optimizing code, lowering its runtime, or by optimizing storage and memory sizes.
Ephemeral storage is available to the function in the /tmp directory and is between 512MB and 10GB. Unless a Lambda function is used to manipulate large files, it should not need more than the minimum value. As for memory, if the function does not request enough memory, it can fail without logging any errors. The Lambda service will log a message after every run with the amount of memory used. In this case, it will log that all available memory was used. Note that it is also possible to use all available memory without any apparent issues. A Lambda function might also be provisioning too much memory. Cloudwatch Logs Insights has a sample query you can run to determine how much memory you are over-provisioning.

filter @type = "REPORT"
| stats max(@memorySize / 1024 / 1024) as provisonedMemoryMB,
  min(@maxMemoryUsed / 1024 / 1024) as smallestMemoryRequestMB,
  avg(@maxMemoryUsed / 1024 / 1024) as avgMemoryUsedMB,
  max(@maxMemoryUsed / 1024 / 1024) as maxMemoryUsedMB,
  provisonedMemoryMB - maxMemoryUsedMB as overProvisionedMB
You can run that query selecting your lambda function log group and a sufficiently significant time interval to determine your maximum over-provisioned memory. Usage may vary throughout the day or on different days. Looking at how many log entries you have can help you determine how much time to look over. Over-provisioned memory is only an indicator of whether you should change your memory allocation for a Lambda function. This is because Lambda functions are allocated CPU based on the configured memory. When you alter the available memory for the function, you will also alter the function run time. You should check the effect on the function runtime. Be sure you have enough data for comparison. Cloudwatch metrics also contain data on your lambda duration, which can also be found in the Lambda function logs.
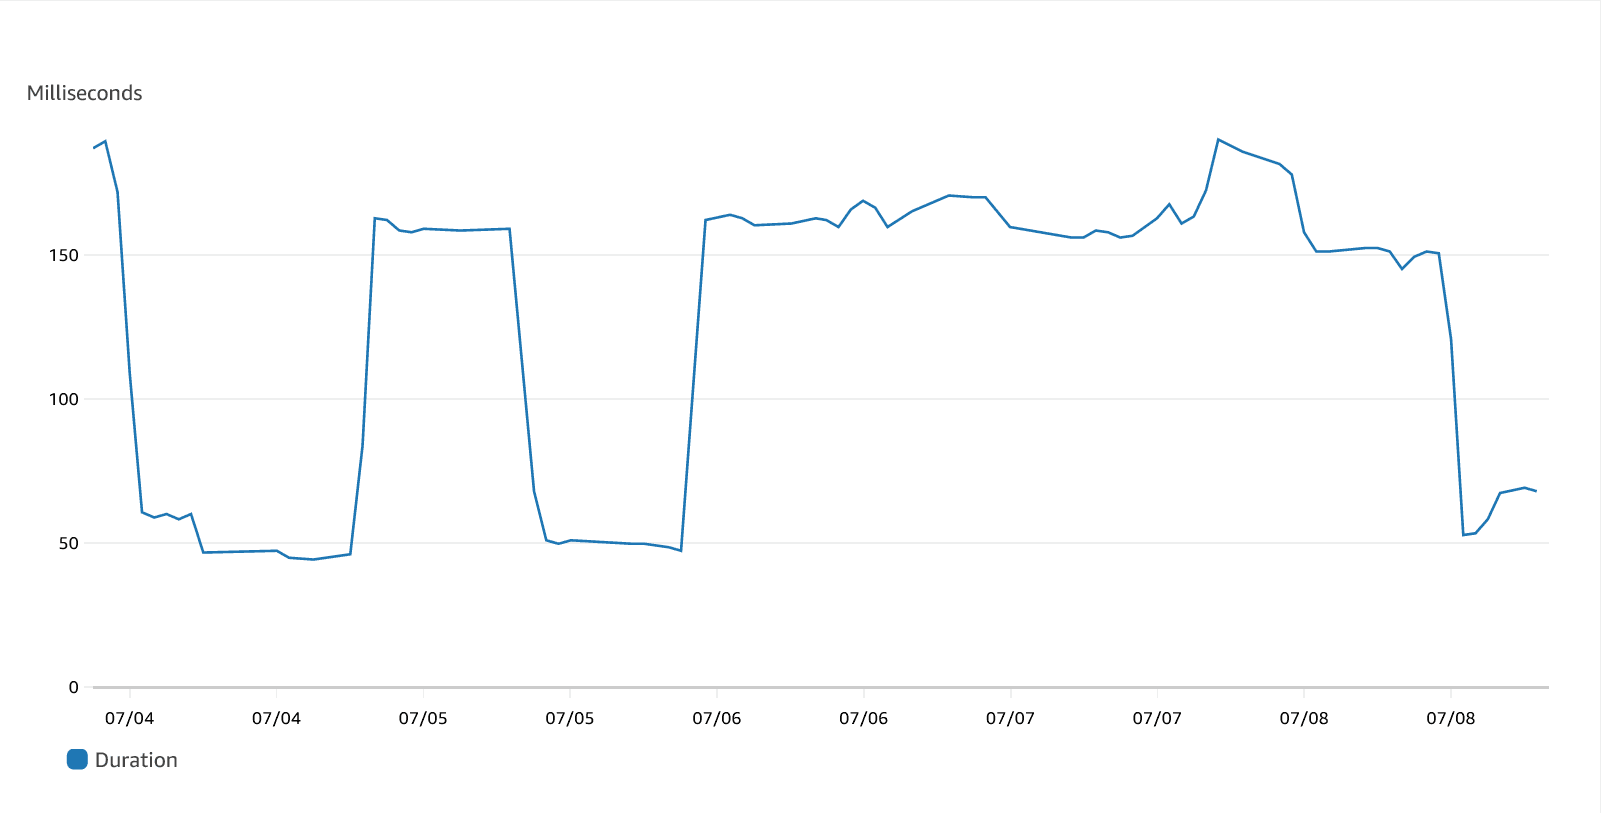
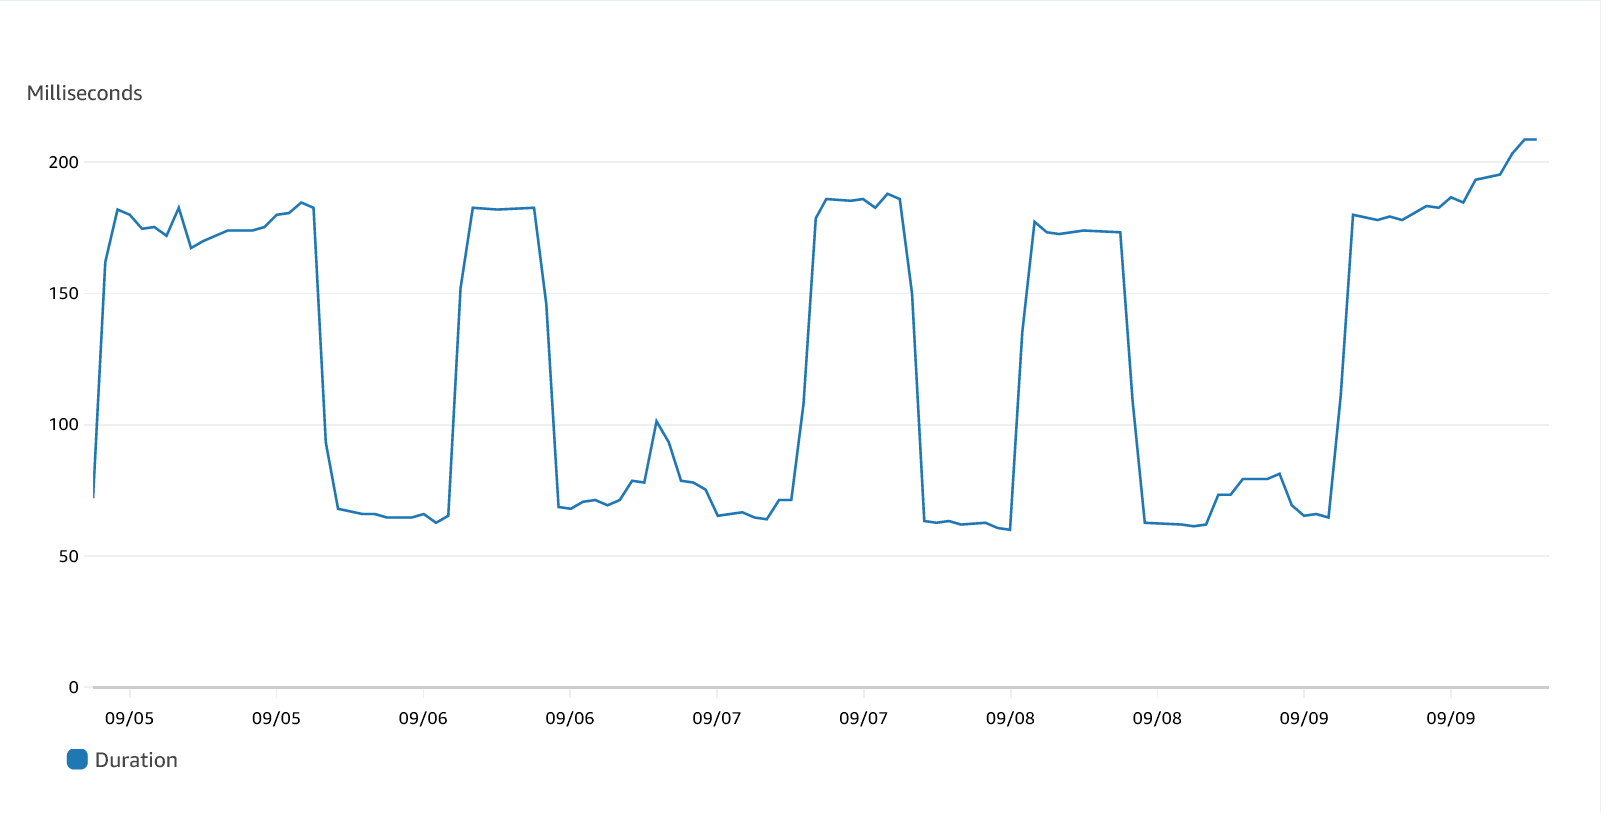
The Pourwall API makes some calls to external APIs, affecting the average duration. Since this depends on which users are online at a given time, we take an average of more than 24 hours of data. Below we reproduce the average durations during a single week of July. If we fail to take into account the high-latency calls, we can end up with an average duration that is up to three times as low. This value will also be directly impacted by increases in memory. This might lead us to maintain (or maybe increase) the overprovisioned memory, even though decreasing it will actually lower cost, in our case.
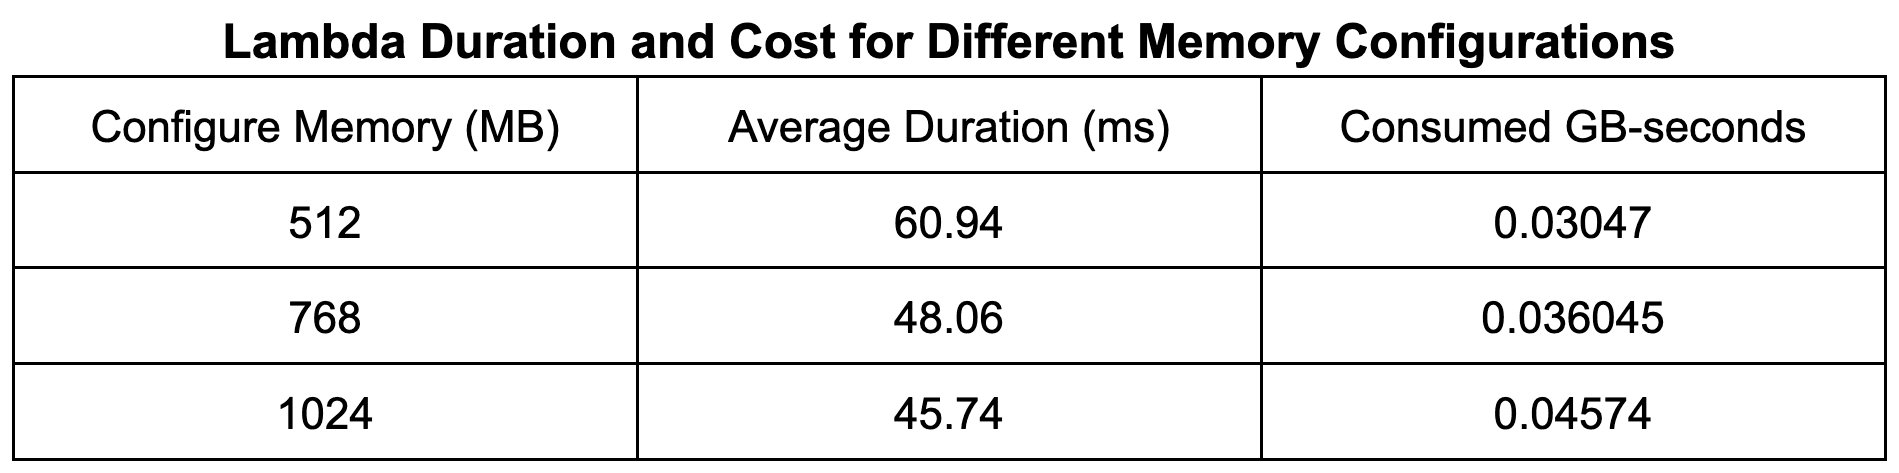
By using the provided query, we found that around 512 MB of memory was over-provisioned. The table below shows the average durations of our lambda function while varying the configured memory. From the table, we can see that lowering the configured memory by the maximum over-provisioned amount significantly affects the performance, increasing the processing time by 33%. This increase is not enough to affect user experience, and the 50% reduction in cost leads to an overall lower cost.
The graph below shows the average duration after the changes were applied. We can see an increase in the average duration, but this still results in an overall decrease in cost as the amount of memory cut is enough to offset this.
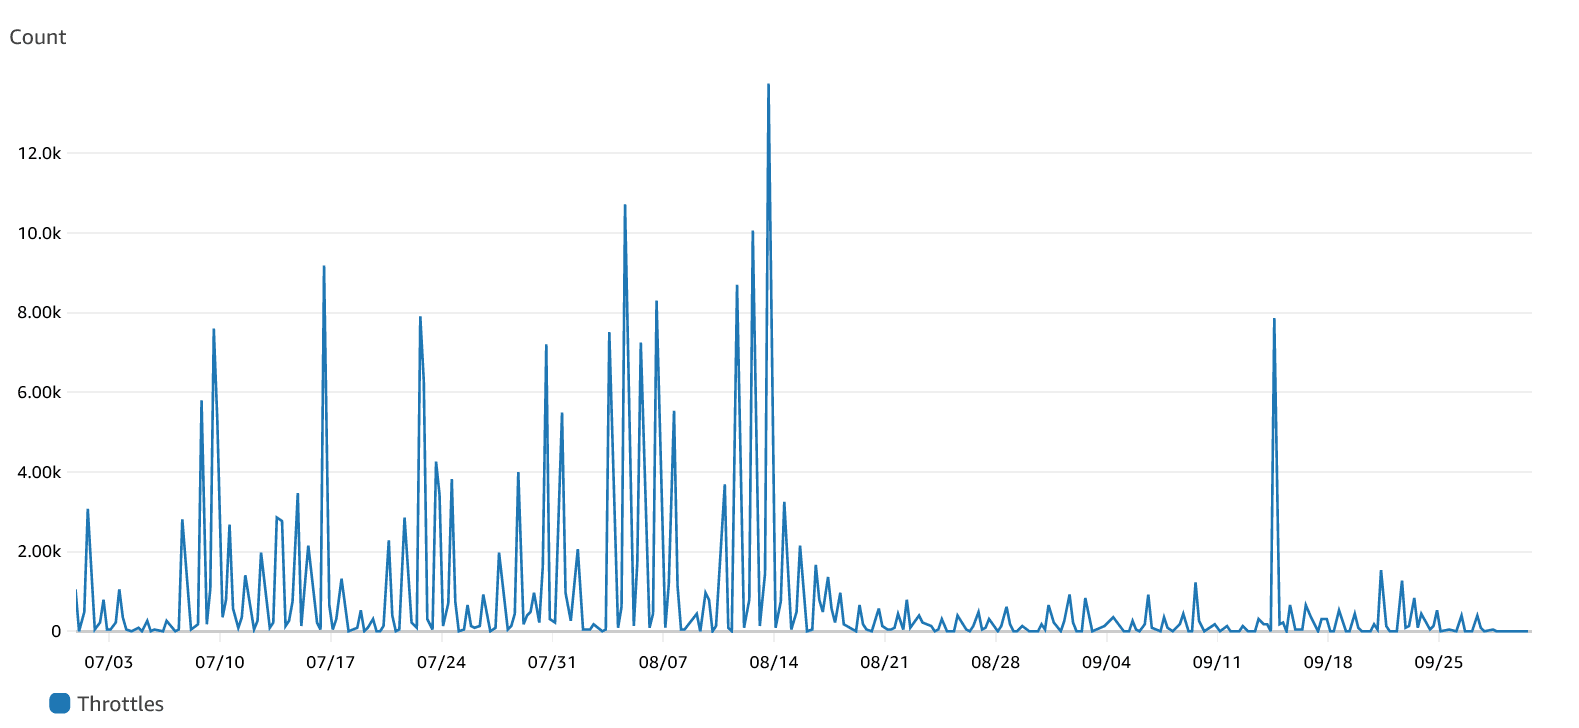
Another factor to consider is the concurrency limit. By default, you can run up to 1000 instances of your Lambda function. You can add concurrency limits to your lambda function to make sure that one function will never take up all the available instances and starve other functions. However, once you set a limit, you may start to see throttling when you reach that limit. This is especially true if the limit is too low. Besides generating errors for the clients, this may also impact your costs. Clients may retry a failed request, incurring further processing costs.
You can see a considerable decrease in throttling after 08/17, when the concurrency limit was increased.
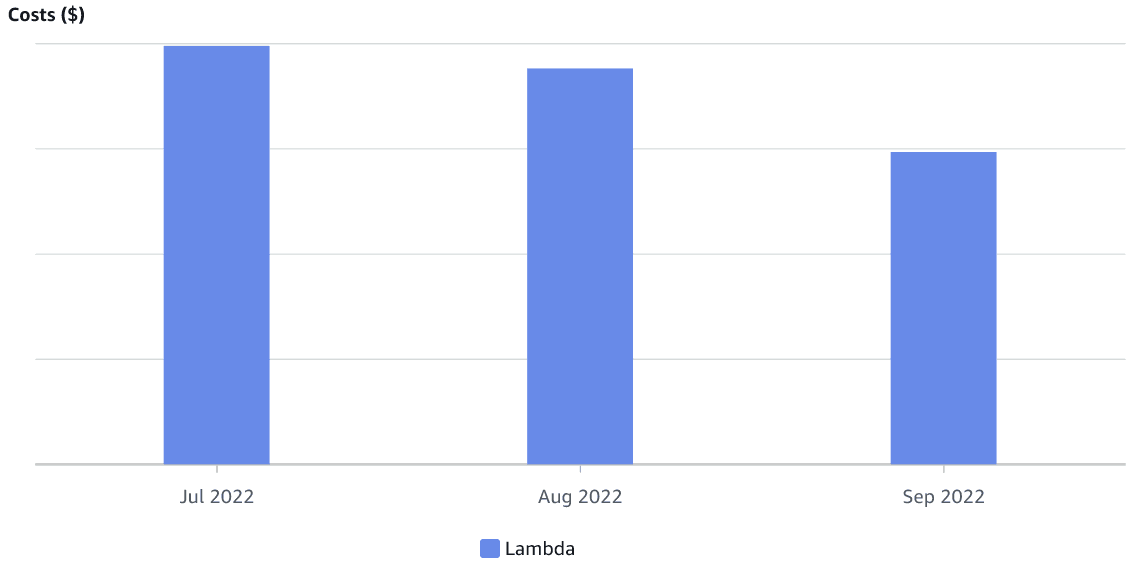
These combined changes resulted in lower monthly costs for our Lambda function, which can be seen in the graph below. Again, there was no significant change in the number of requests being made during this period.
Our service allows users to upload images for backgrounds and other menus. These images are uploaded to an S3 bucket and downloaded by the application website and the TV apps. Our service also allows for the creation of an iframe so users can embed their tap list in another website. The application was using the S3 bucket URLs directly, so all data was being downloaded directly from S3. Most clients will cache the downloaded images, and response headers will come with a cache-control header. However, client caching is managed by the client application and may not always work. S3 has a logging feature that makes it possible to determine which keys (or files) are being requested. S3 logs are saved to an S3 bucket as multiple CSV files. After joining the data in these files, the below graph was generated. It shows the number of requests for each key over a period of 24 hours. For simplicity, only the top 20 keys were included.
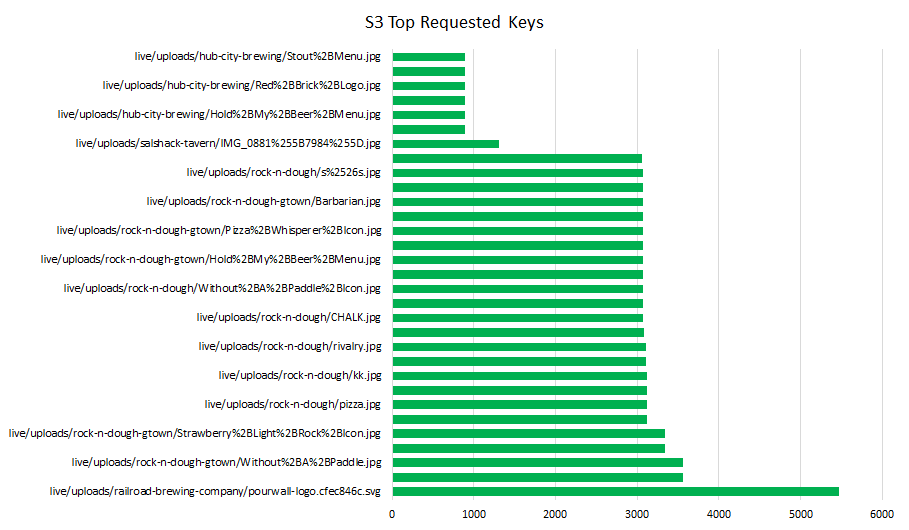
The top 20 images are being requested at least 800 times a day, with the top image being requested over 5000 times. Using CloudFront for this content is one way to lower costs. When a cached resource is requested, no request is made to S3, lowering the S3 bandwidth cost. This pattern of repeated requests from the same client will be able to use CloudFront caching. We set up a CloudFront distribution for the uploaded content and altered our application configurations to use the new CloudFront distribution. Our CloudFront distribution uses Price Class 100, which uses edge locations in North America, Europe, and Israel. This is because most of our users are in North America and Europe, and we do not have a very latency-sensitive application. Using the class will also guarantee that the CloudFront bandwidth will be cheaper than the S3 bandwidth.
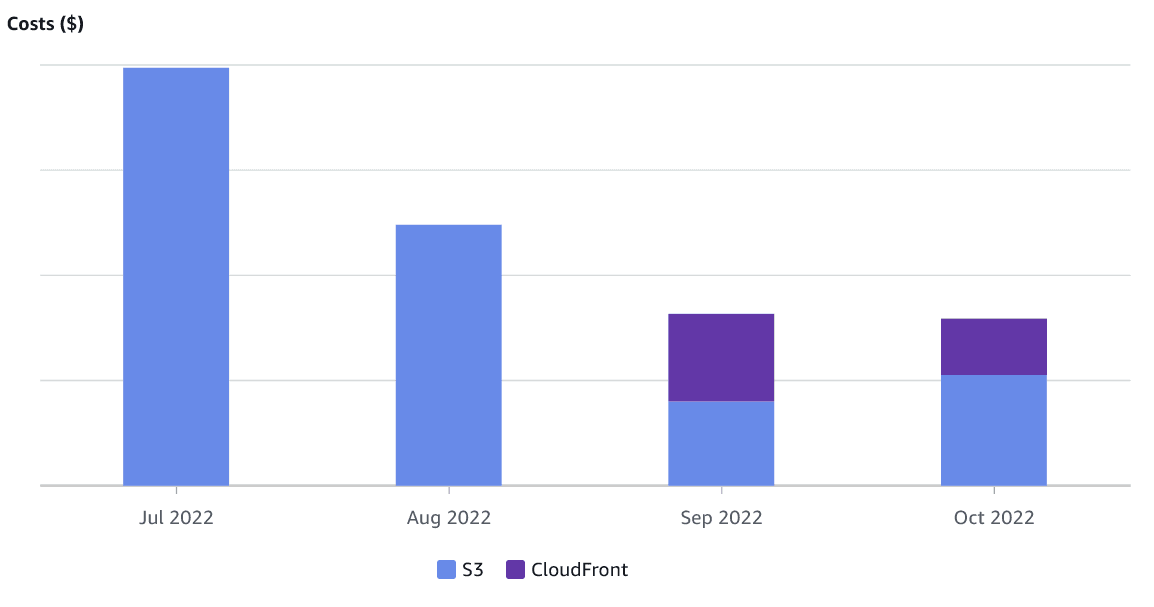
We can see the effect of the CloudFront distribution on the S3 costs in the graph below, covering the same 3-month period as before. The valley in cost is due to the free tier offered by AWS. During that period, both the S3 and CloudFront bandwidth falls within this tier, and the account incurs no charges.
Below, we reproduce the costs for the same 3-month period as above. The month of September is still missing some data, as it had not yet ended at the time of writing. However, we can clearly see the effect of the changes rolled out in the month of August. API Gateway requests are no longer the largest portion of our bill. It is, in fact, now our third most expensive service, behind Lambda and Cloudwatch.
As mentioned in the beginning, we now have new priorities for cost optimization. We should now continue our focus on Lambda optimizations but also turn an eye to Cloudwatch. In a future blog post, we will dive deeper into how we lowered Lambda costs by getting rid of polling through the use of WebSockets.