
Create, Test, and Deploy a Typescript Lambda with CDK
- Development


Thiago Afonso Thiago Afonso
January 21, 2025 • 5 min read
Debugging: the art of being a detective in a crime scene where you're also the prime suspect. While traditional debugging tools help you find out why your perfectly written code (you’d think!) decided to throw a tantrum, certain tools are specifically designed to provide insights into performance bottlenecks, enabling developers to improve the efficiency of their applications.
Performance in React Native isn’t exactly a cakewalk. It’s a delicate balancing act between JavaScript, native modules, and the occasional head-scratcher. To achieve smooth performance, you first need to know where the bottlenecks are—and that’s where debugging tools come in. Let’s dive in!
React Native offers several built-in tools to assist in the debugging process:
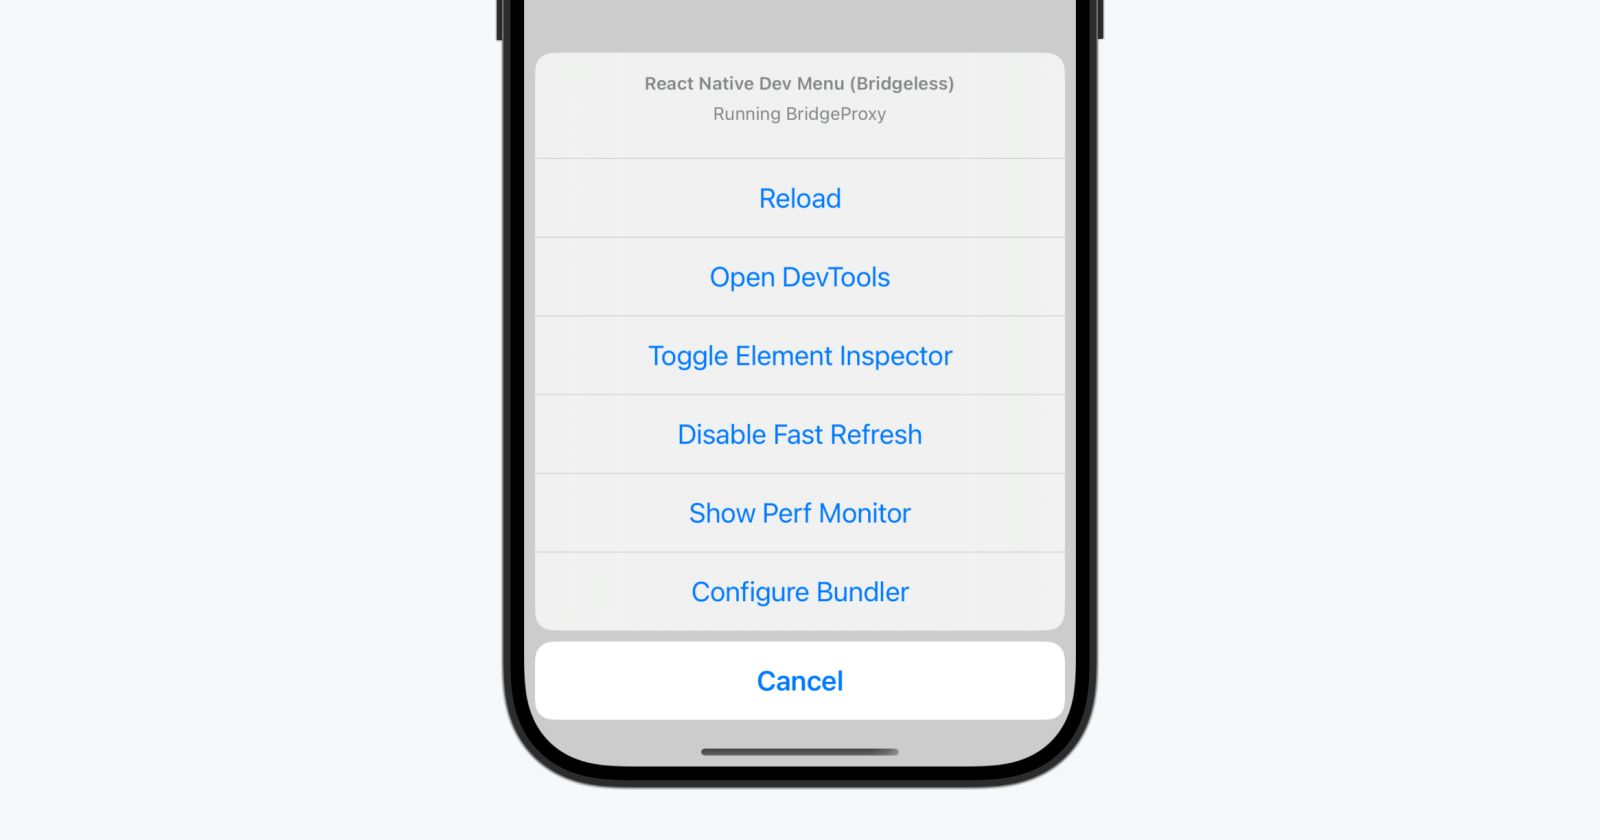
These are fine tools, but they often leave you wondering about what’s slowing things down. Let’s level up.
When it comes to optimizing React Native applications, having the right tools is crucial. These performance-focused debugging tools go beyond basic error tracking—they help you understand the inner workings of your app, identify performance bottlenecks, and make data-driven optimization decisions. Let's explore some of the most powerful tools in a React Native developer's performance optimization toolkit.
WDYR is like a lie detector test for React components—it tells you exactly when and why they re-render. Imagine spotting that one child component re-rendering 500 times because of a single prop change. With WDYR, you can catch and fix these “oops” moments.
Its installation process is very straightforward and simple. Check it out:
Install the package:
npm install @welldone-software/why-did-you-render --save-dev
Create a wdyr.js file in the root directory with the following content:
import React from 'react';
import whyDidYouRender from '@welldone-software/why-did-you-render';

if (process.env.NODE_ENV === 'development') {
  whyDidYouRender(React, {
    trackAllPureComponents: true,
  });
}
Import wdyr.js at the top of your entry file (e.g., index.js):
import './wdyr';
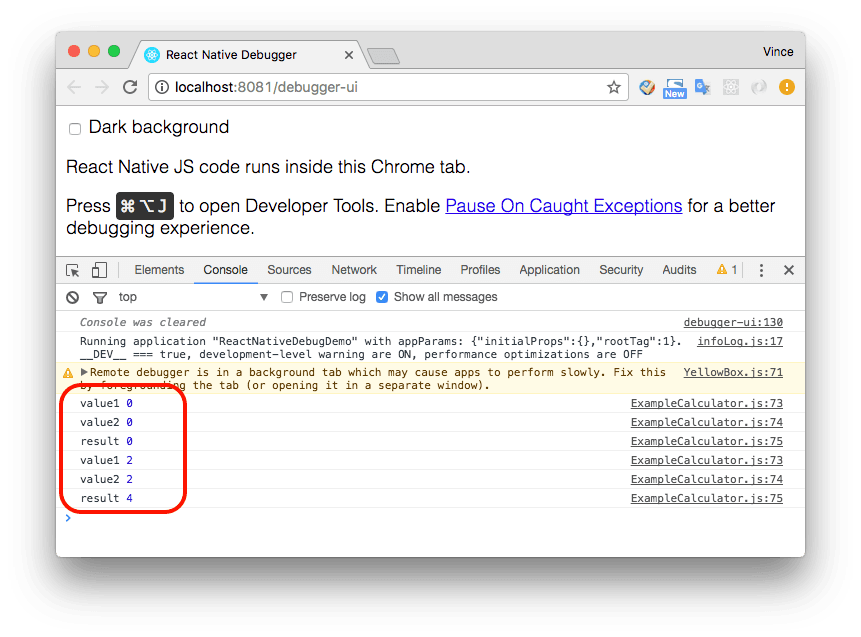
Now, your console will provide detailed logs showing which components are re-rendering and why. You'll see information about prop changes, state updates, and other triggers that cause components to refresh unnecessarily.


Meet the shiny new React Native DevTools —a step up from Chrome DevTools. It combines React Inspector, Redux DevTools, and a profiler to track performance issues and visualize bottlenecks.
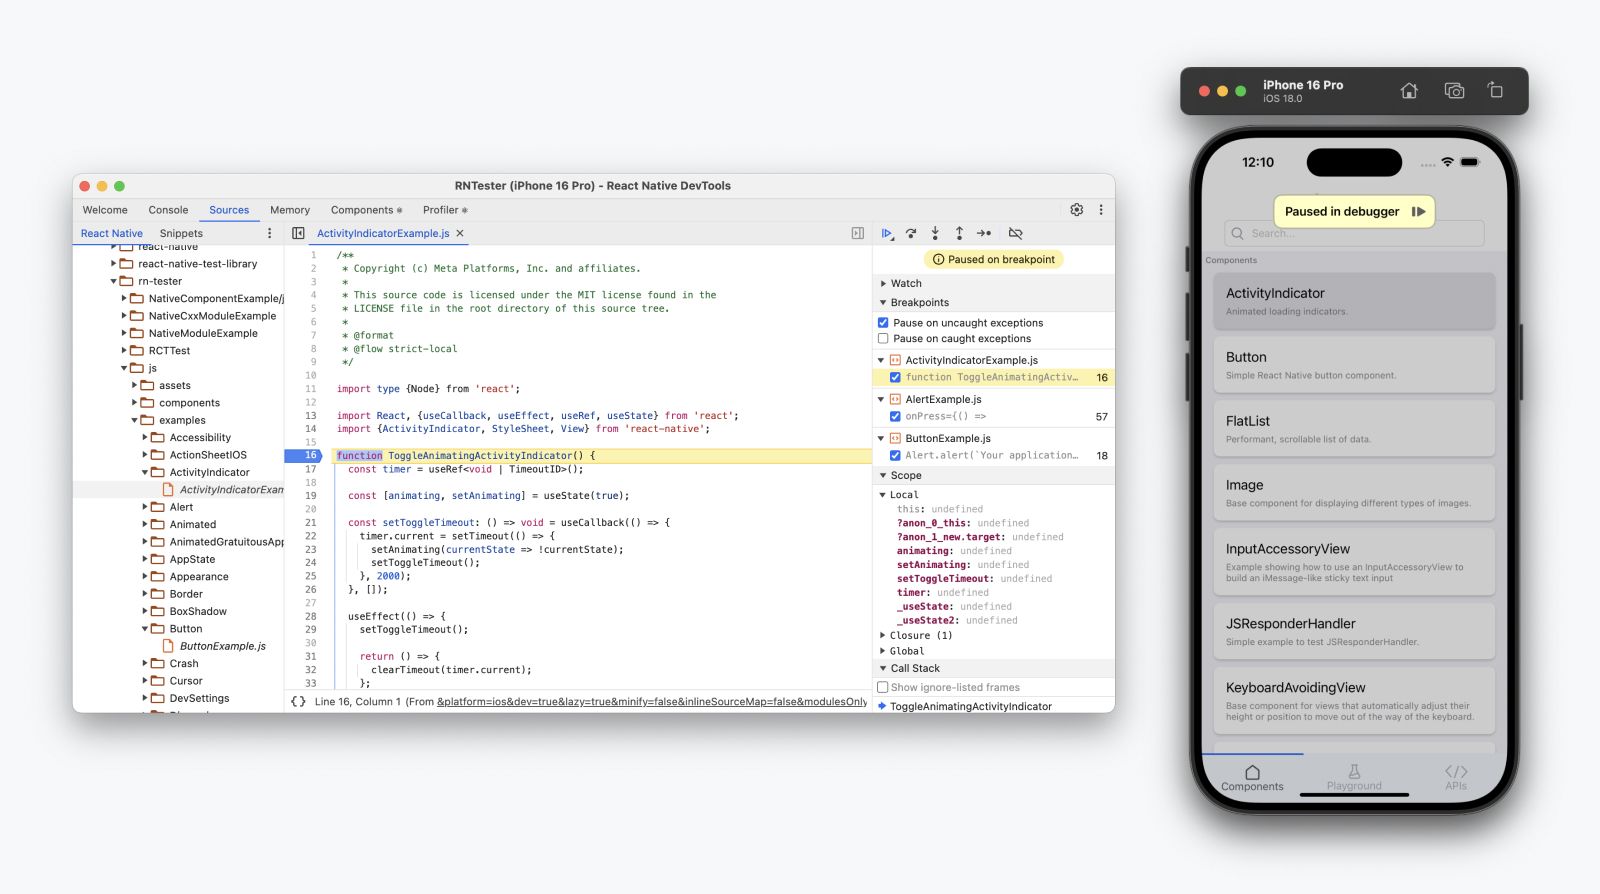
Why It’s Awesome:
Here's how to quickly enable it:
npx react-devtools.With these tools, you can identify exactly which components need optimization and improve your app’s performance.
Performance optimization isn't just a technical necessity—it's the difference between an app that delights users and one that frustrates them. Slow load times, laggy interactions, and unresponsive interfaces can turn even the most promising app into a source of user frustration.
When your app runs at a snail’s pace, this is how your users feel:
Don’t let your app be the reason phones meet walls.
Once performance bottlenecks are identified using the tools above, developers can apply React best practices to optimize their applications:
React.memo to prevent unnecessary re-renders of functional components when their props haven't changed.React.PureComponent enables shallow prop and state comparison, reducing unnecessary updates.FlatList instead of ScrollView to improve performance by rendering only visible items.Debugging in React Native isn’t just about fixing bugs; it’s about building apps that make users smile instead of rage quit. By using tools like WDYR and the new React Native DevTools, you can identify performance bottlenecks and create buttery-smooth apps.
So, put on your detective hat, squash those bugs, and make your app a joy to use. Your users—and their phones—will thank you.