Writing User Stories for Front-End Development
- Development

Lucas SartoriLucas Sartori
November 27, 2023 • 21 min read
Sometimes I catch myself wondering about how we take for granted most of the tech we have nowadays. One of these things is mapping. If one day Google Maps stops working and I have to get to even the most trivial places where I live, I’ll be in deep trouble. If you were to tell Lucas from 15 years ago that we’d have these devices that allow us not only to see where we are in an interactive map but also to trace a route from point A to point B, I’d never believe you.
Turns out that life has found its way of pushing me exactly to the place where I would be working with this specific piece of tech that fascinates me. In this article I’ll share a little of what I learned working with web mapping and OpenLayers.
First let’s ask ourselves: how does this even work and what’s the history behind it? I won’t get into specifics, but it evolved alongside with modern browsers; in 2005 Google Maps was released completely revolutionizing the field of web mapping, before that there were only proprietary solutions that were pretty much inaccessible to the general public. Taking the momentum of the neat emerging tech, OpenLayers was released one year later as an Open Source alternative, allowing users to integrate maps from multiple sources, including Google Maps.
To sum it up, here’s a timeline:
But how does this all work nowadays? There are multiple ways that you can set up an interactive map on the web. Usually it’s a mix between consuming data from a server (something like GeoServer) that processes data from a database that can be specialized or not. One of the most notable specialized databases is PostGIS, it offers a lot of functionality tailored for mapping out of the box.
When it comes to rendering in the front-end, there are indeed multiple ways to choose from, all of them with their specific tradeoffs.
At the end of the day, it all comes down to a library (in our case OpenLayers) stacking images and elements on an html canvas.
Here’s a glossary of some common terms you will see in this world:
I’ve been talking about OpenLayers, but it should be known that even though it is indeed the grandfather of all open source web mapping libraries, it is not the only one out there. The ecosystem has grown a lot and evolved alongside modern web browsing and the javascript ecosystem. New libraries such as Leaflet.js offer a lot of flexibility and are easier to use and maintain depending on the use case. For more complex use cases OpenLayers still allows for a lot of customization and is and will be open source for the foreseeable feature.
Other than Leaflet, another one worth mentioning is Mapbox; tech giants love it. Platforms like Uber, Evernote, Foursquare all use it and there are a lot of baked inner goodies that you can’t find anywhere without significant and expensive developer work, such as built-in navigation libraries, 3D views, an out-of-the-box aesthetically pleasing experience (Openlayers really lacks in this regard, it gives nothing but the primitives necessary to build the maps). However it should be noted that all of this comes with vendor lock-in, it’s not particularly easy to emulate any of those services that mapbox offers without considerable effort.
Here are the Pros and Cons of the various platforms that are available in 2023:
Now that we talked and explored a little of the web mapping world, I want to propose a simple project to explore what we can do: plot a simple web map with the faces of the Beta Acid folks!
First of all, given these constraints, what exactly would make sense to use here? We need an interactive map which will plot a few markers around a world map, the user should be able to zoom in and out and interact with the markers.
Not a lot of data, simple interactive web mapping. Seems like an excellent fit for OpenLayers and a simple GeoJSON.
First of all, let’s get our data ready, I created a json file for us to use with random locations and fun lord of the rings-ish names!
You can see that each marker has the following data:
{
     "type": "Feature",
     "geometry": {
       "type": "Point",
       "coordinates": [-64.58964736550732, -16.435949919838503]
     },
     "properties": {
       "name": "Lucas Sartori Moraes",
       "image": "https://betaacid.co/_next/image?url=https%3A%2F%2Fmedia.graphassets.com%2F79voaePJRgGLDTon1vko&w=1080&q=75",
       "country": "North Tirithmoor",
       "city": "East Shiretown"
     }
   },
Coordinates, which will be read by our mapping engine, and metadata about the specific marker (in the OpenLayers world, a Feature )
We basically need to read this GeoJSON and then display it in our map. Let’s get started with my trusty ol’ Angular framework to make our lifes a little easier:
In our root folder:
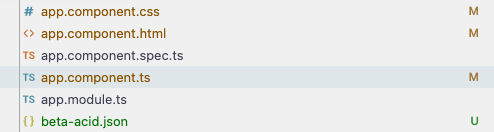 In
In app.component.ts, let’s scaffold our map:
export class AppComponent implements AfterViewInit {


 async ngAfterViewInit() {
   this.initializeSources();
   await this.initializeMap();
   this.addInteractions();
 }
}
What we’re doing here is basically setting up what we want to do, let’s go ahead and implement initializeSources()
 initializeSources(): void {
   const geoJsonFormat = new GeoJSON();
   this.pointSource = new VectorSource({
     features: geoJsonFormat.readFeatures(geoData, {
       featureProjection: 'EPSG:3857',
     }),
   });
 }
What is happening here? We’re using OpenLayers’ built-in GeoJSON to initialize and read our data, and then attach it to a VectorSource, which is a data structure responsible for serving and sanitizing our data in a way that is usable by OpenLayers. Our file now looks like this:
import { AfterViewInit, Component } from '@angular/core';
import { Map } from 'ol';
import VectorSource from 'ol/source/Vector';
import * as geoData from './beta-acid.json';
import GeoJSON from 'ol/format/GeoJSON';


@Component({
 selector: 'app-root',
 templateUrl: './app.component.html',
 styleUrls: ['./app.component.css'],
})
export class AppComponent implements AfterViewInit {
 mapInstance!: Map;
 pointSource!: VectorSource;


 async ngAfterViewInit() {
   this.initializeSources();
   await this.initializeMap();
   this.addInteractions();
 }


 async initializeMap(): Promise<void> {}


 initializeSources(): void {
   const geoJsonFormat = new GeoJSON();
   this.pointSource = new VectorSource({
     features: geoJsonFormat.readFeatures(geoData, {
       featureProjection: 'EPSG:3857',
     }),
   });
 }


 addInteractions(): void {}
}
Let’s try to render something implementing the function initializeMap
async initializeMap(): Promise<void> {
   const tileLayer = new TileLayer({
     source: new OSM(),
     zIndex: 10,
   });


   const markerLayer = new VectorLayer({
     source: this.pointSource,
     zIndex: 20,
   });


   this.mapInstance = new Map({
     view: new View({
       center: [0, 0],
       zoom: 1,
     }),
     layers: [tileLayer, markerLayer],
     target: 'map',
	controls: []
   });
 }
Here we initialize our map, which is represented by TileLayer, importing the OSM module from OpenLayers. OSM stands for OpenStreetMaps, it is baked in the library and gives us a ready to use map out of the box. Still, we can’t see anything rendering! Let’s fix that.
Remember that in our mapInstance object, we’re targeting ‘map’. It is the ID of the element that it will look for in our page.
In app.component.html:
<div class="map" id="map"></div>
This is where our map is gonna live; OpenLayers will render a canvas in this div.
Let’s also make it fullscreen, in app.component.css:
.map {
 width: 100vw;
 height: 100vh;
}
Save it and refresh the page. You should be able to see something like this:
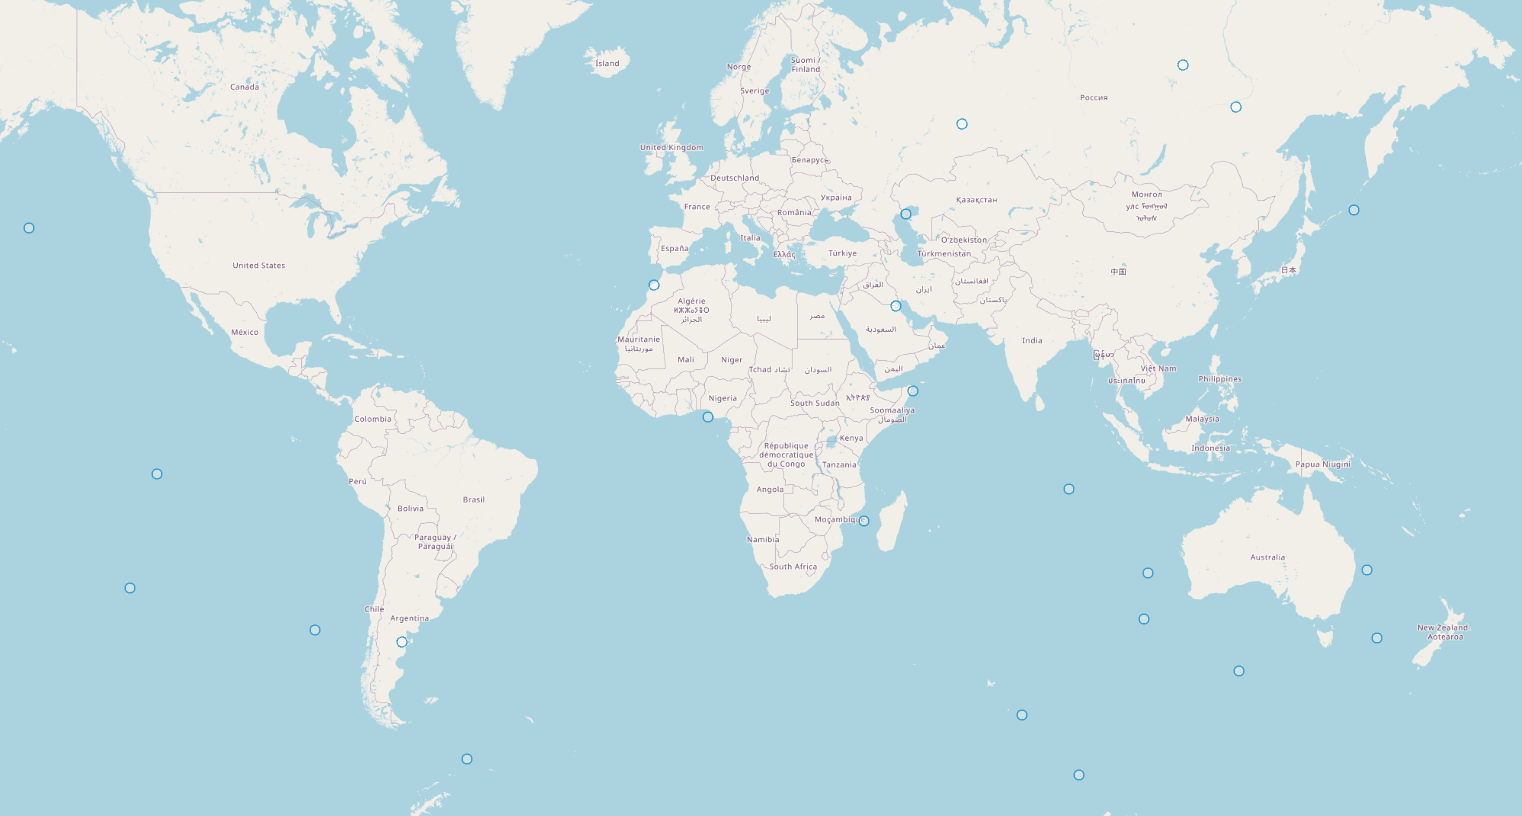
We can see our markers! Our code so far looks like this:
import { AfterViewInit, Component } from '@angular/core';
import { Map, View } from 'ol';
import VectorSource from 'ol/source/Vector';
import * as geoData from './beta-acid.json';
import GeoJSON from 'ol/format/GeoJSON';
import TileLayer from 'ol/layer/Tile';
import { OSM } from 'ol/source';
import VectorLayer from 'ol/layer/Vector';


@Component({
 selector: 'app-root',
 templateUrl: './app.component.html',
 styleUrls: ['./app.component.css'],
})
export class AppComponent implements AfterViewInit {
 mapInstance!: Map;
 pointSource!: VectorSource;


 async ngAfterViewInit() {
   this.initializeSources();
   await this.initializeMap();
   this.addInteractions();
 }


 async initializeMap(): Promise<void> {
   const tileLayer = new TileLayer({
     source: new OSM(),
     zIndex: 10,
   });


   const markerLayer = new VectorLayer({
     source: this.pointSource,
     zIndex: 20,
   });


   this.mapInstance = new Map({
     view: new View({
       center: [0, 0],
       zoom: 1,
     }),
     layers: [tileLayer, markerLayer],
     target: 'map',
     controls: [], // just to get rid of outdate OL interface
   });
 }


 initializeSources(): void {
   const geoJsonFormat = new GeoJSON();
   this.pointSource = new VectorSource({
     features: geoJsonFormat.readFeatures(geoData, {
       featureProjection: 'EPSG:3857',
     }),
   });
 }


 addInteractions(): void {}
}
This however is not exactly what we want to see, let’s try to render everyone’s custom photo from the website as their marker. For this, we’ll use OpenLayers’ Style API. We want to render names and photos, so it’ll look like this:
function createStyle(feature: FeatureLike) {
 const name = feature.get('name');
 const photo = feature.get('image');


 if (name && photo) {
   const individualStyle = new Style({
     image: new Icon({
       src: photo,
       width: 50,
       height: 50,
     }),
     text: new Text({
       text: name,
       font: 'bold 12px Arial',
       fill: new Fill({
         color: 'black',
       }),
       offsetY: 35,
       stroke: new Stroke({
         color: 'papayawhip',
         width: 1,
       }),
     }),
   });
   return [individualStyle];
 }


 return [];
}
You can check out the Style API in OpenLayers’ official documentation. We are restricted in what we can do here, it is a canvas and we need to work with vectors. Most of the basic cases are covered but you can always use the canvas API if you need custom fancy stuff. Now we just need to add style: createStyle to our markerLayer and we should be good to go!
   const markerLayer = new VectorLayer({
     source: this.pointSource,
     style: createStyle,
     zIndex: 20,
   });
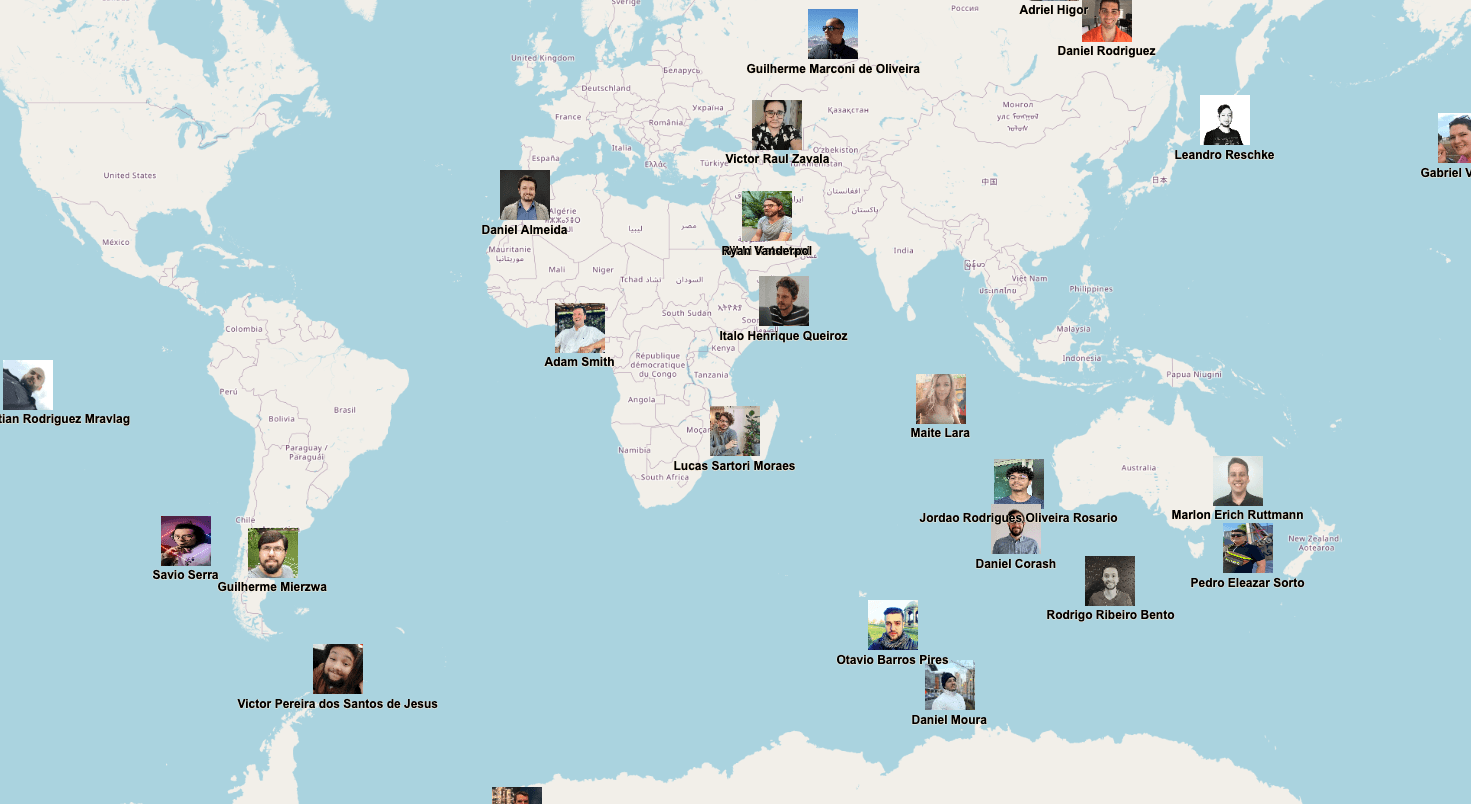
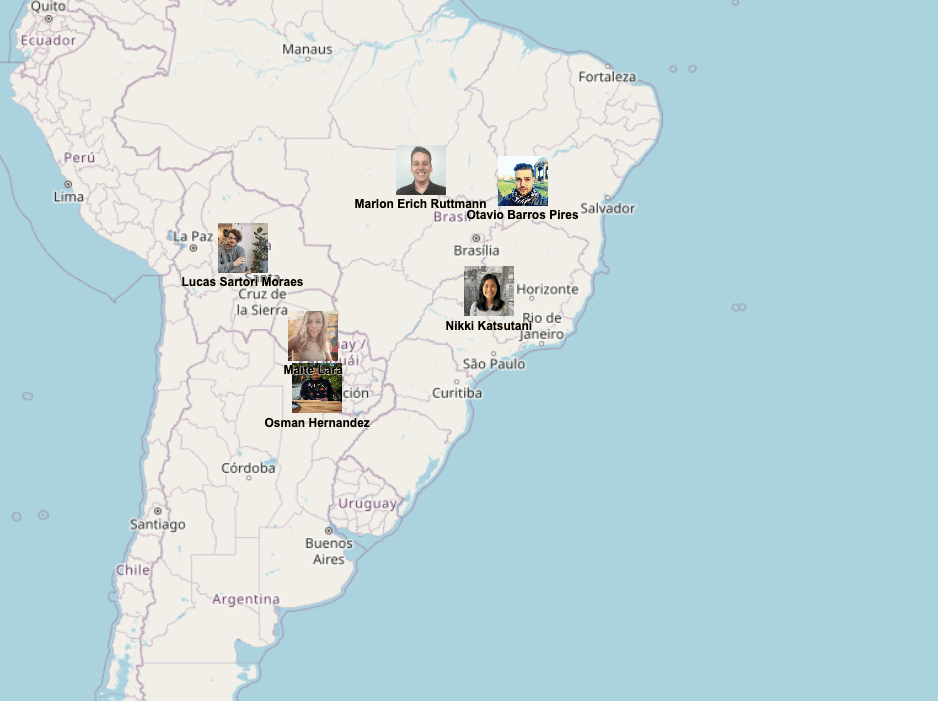
Would you look at that! We got everyone’s faces and names rendering already, and fully interactively!
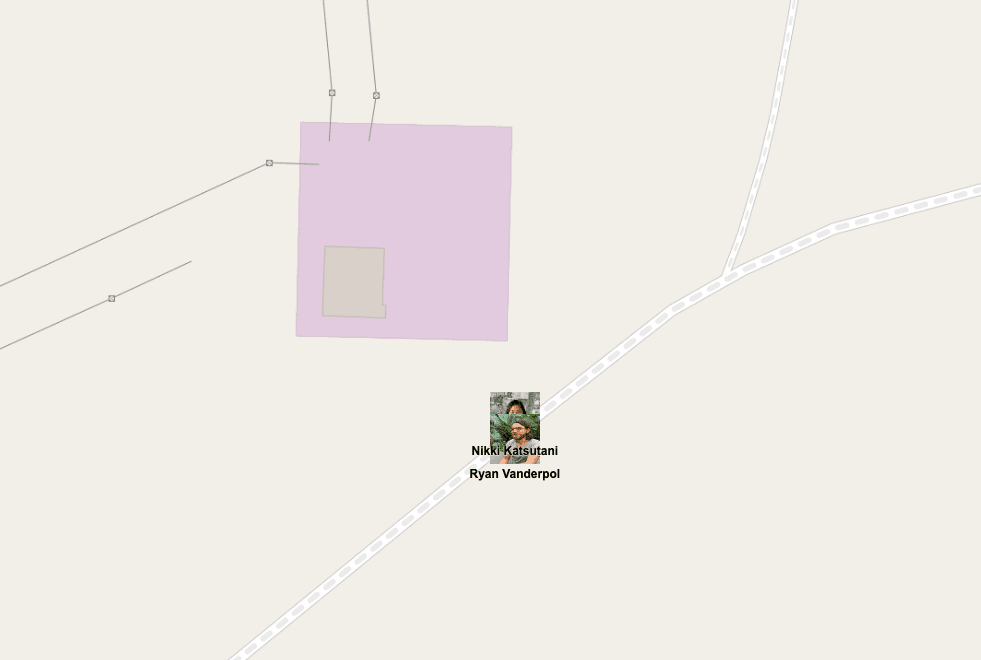
Still, we need to figure out what to do with people that are too close to each other, for instance those two people down in Saudi Arabia:
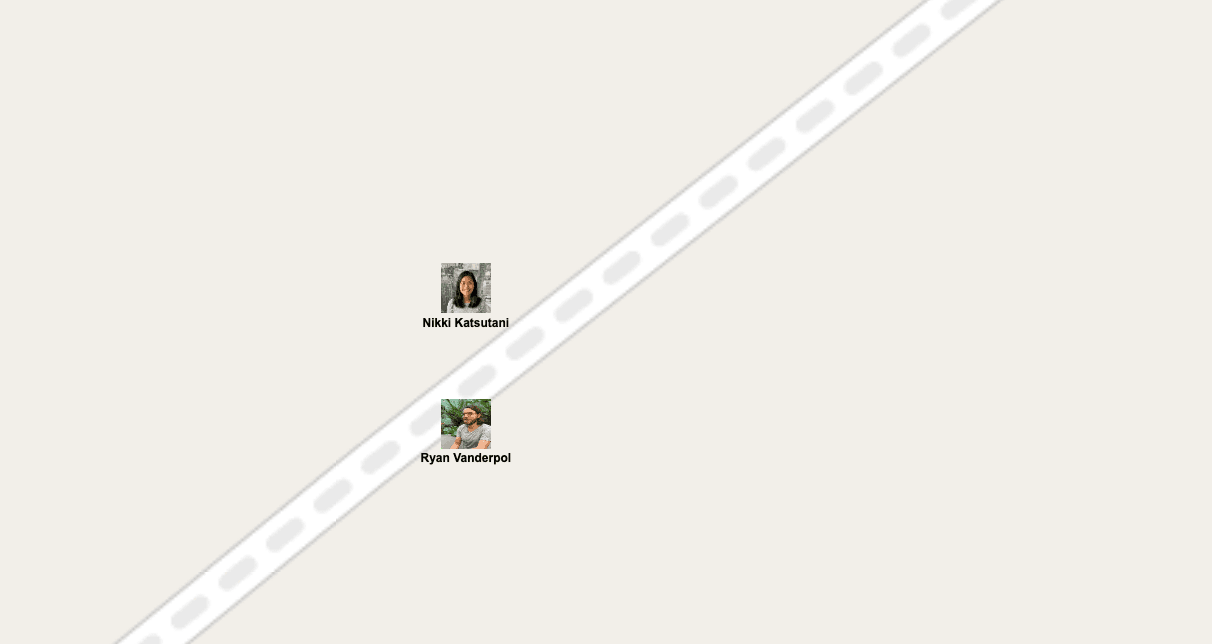
From this zoom level it looks okay, but if you zoom out it clearly becomes a problem:
The markers are overlapping with each other. How to solve that? Clustering. There are plenty of ways to do that, but here we’ll focus on handling it on the frontend.
Clusters are a Layer by themselves, you can mix and apply different styles to clusters depending on our needs.
In our small project we’ll ditch our normal tileLayer and work exclusively with a clusterLayer.
Let’s initialize it’s source at the top of the component:
clusterSource!: Cluster;
and in initializeSources:
this.clusterSource = new Cluster({
     distance: 50,
     minDistance: 50,
     source: this.pointSource,
   });
Now our markerLayer should use clusterSource instead of pointSource:
   const markerLayer = new VectorLayer({
     source: this.clusterSource,
     style: createStyle,
     zIndex: 20,
   });
Neat! But you should notice that now nothing is rendering. That is because our createStyle function isn’t prepared to deal with clusters. Let’s fix that.
function createStyle(feature: FeatureLike) {
 const clusterProperties = feature.getProperties();
 const isCluster = clusterProperties['features'].length > 1;


 const clusterStyle = new Style({
   image: new Icon({
     src: 'https://images.crunchbase.com/image/upload/c_lpad,h_256,w_256,f_auto,q_auto:eco,dpr_1/mglhdx06vkmjnnmez7er',
     scale: 0.2,
   }),
   text: new Text({
     text: clusterProperties['features'].length.toString(),
     font: 'bold 12px Arial',
     offsetX: 35,
     stroke: new Stroke({
       color: 'white',
       width: 3,
     }),
   }),
 });


 if (isCluster) {
   return [clusterStyle];
 }


 const name = clusterProperties['features']?.[0]?.get('name');
 const photo = clusterProperties['features']?.[0]?.get('image');


 if (name && photo) {
   const individualStyle = new Style({
     image: new Icon({
       src: photo,
       width: 50,
       height: 50,
     }),
     text: new Text({
       text: name,
       font: 'bold 12px Arial',
       fill: new Fill({
         color: 'black',
       }),
       offsetY: 35,
       stroke: new Stroke({
         color: 'papayawhip',
         width: 1,
       }),
     }),
   });
   return [individualStyle];
 }


 return [clusterStyle];
}
As you can see, we’re checking whether we have more than 1 point at the specific point based on the distance we set when instantiating clusterSource, and if there is more than 1 feature at that point, we render the Beta Acid logo, if not we construct the individual style instead. The API is indeed pretty imperative but remember that we’re working with the canvas API.
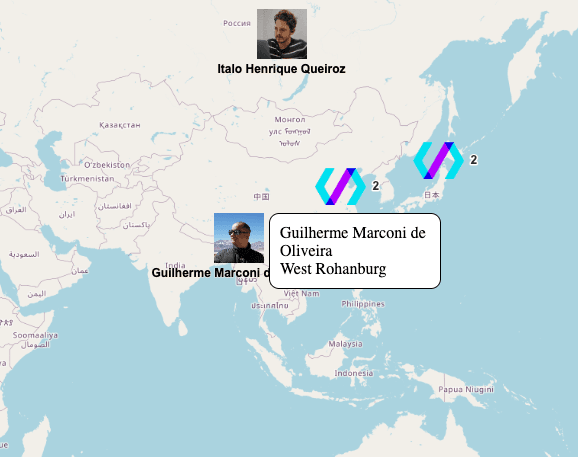
Here’s our result:
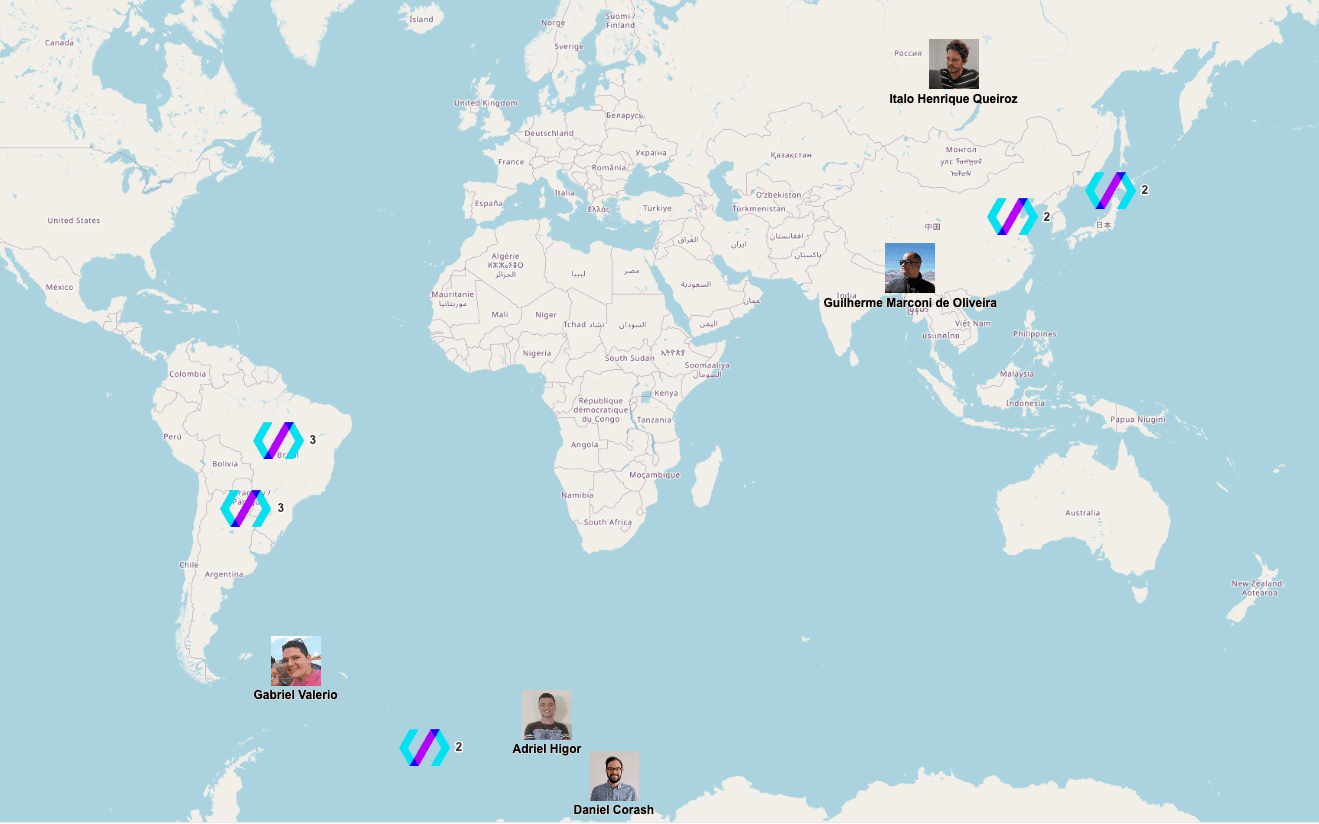
Feel free to play around with cluster distance to see how it behaves, zooming in will make new people appear!
Here’s the complete code at this point: https://gist.github.com/fang0rnz/a3e937c6f9ac024f135045b257b01072
Now last but not least, we want to add interactions to these markers!
addInteractions(): void {
   const hoverSelect = new Select({
     condition: pointerMove,
     style: createStyle,
   });


   this.mapInstance.addInteraction(hoverSelect);


   hoverSelect.on('select', (e) => {
     if (e.selected.length > 0 && e.selected[0].get('features').length === 1) {
       const feature = e.selected[0].get('features')[0];
       console.log(feature);


       this.showOverlay(feature);
     } else {
       this.hideOverlay();
     }
   });
 }
OpenLayers provides a bunch of possible interactions baked inside it. We want to show an overlay when hovering above someone’s photo. But you can also add custom interactions such as specific key presses, clicks, etc. You can also change the selected marker’s style depending on interaction, here we don’t want to do that, so let’s try to just show an overlay.
In order to do that, let’s create a Details component that will render inside the map.
@Component({
 selector: 'details-component',
 template: ` <div class="overlay">
   <div>{{ name }}</div>
   <div>{{ city }}</div>
 </div>`,
 styles: [
   `
     .overlay {
       position: absolute;
       background-color: white;
       border-radius: 10px;
       padding: 10px;
       width: 150px;
       border: 1px solid black;
     }
   `,
 ],
})
class Details {
 @Input() name!: string;
 @Input() city!: string;
}
Now onwards to the showOverlay and hideOverlay function:
showOverlay(feature: any): void {
   const coordinate = feature.getGeometry().getCoordinates();
   const componentRef = this.overlayContainer.createComponent(Details);


   componentRef.instance.name = feature.get('name');
   componentRef.instance.city = feature.get('city');


   const overlay = new Overlay({
     element: componentRef.location.nativeElement,
     position: coordinate,
     positioning: 'bottom-center',
     offset: [30, -25],
   });


   if (this.overlay) {
     this.mapInstance.removeOverlay(this.overlay);
   }


   this.mapInstance.addOverlay(overlay);
   this.overlay = overlay;
 }


 hideOverlay() {
   this.overlay.setPosition(undefined);
 }
Great! Remember to initialize the Overlay containers and the other goodies.
Here is the gist so far: https://gist.github.com/fang0rnz/8fb80be49046b74cd1c3fb78efd66986
This is it! There is a lot I didn’t dive in, such as decluttering, mixed clusters and more advanced things, but we have a fully working interactive map! I hope you were able to learn something from me with this code-along.